We have already generated and rendered a heightmap, and now it’s time to add the next map layer — vegetation map based on biomes definition. The theme is boundless, but I’m going to cover both biomes generation and rending in a single post. The first reason that I’m a bit tired of it, the second — there are already some good tutorials available. From the procedural generation perspective theme was covered by Jon Gallant, Scott Turner, Amit Patel, Tommy Waters and Miguel Cepero. There are also a lot of materials prepared by Cartographers Guild members.
As you may notice, in all of the articles linked above biome generation is based on a the same principle. A well-known Whittaker diagram shows the distribution of vegetation types as a function of mean annual temperature and precipitation and hence very convent to use in a procedural generation. All that we need is to define precipitation and temperature for each polygon, prepare our own diagram and define the biomes based on these three components.
The precipitation model was already prepared for a river systems generation. As of temperature, I decided to use the model based on annual average sea temperature and land elevation. We create Islands, and even I’m still not sure, but our Islands seems to be about 100k square kilometers (~40 sq mi) in area. Like real-world Ireland or Iceland. What we know about the island is that their climate is profoundly impacted by ocean temperature, not by the latitude. And it is so even for a such a big islands like Ireland, having insignificant regional temperature variation. Generally it’s not “a warm South and a colt North” as in continental Europe, but “a bit warmer coastline and cooler inland areas”. So the sea temperature is the first key value.
One more observation is that we, unintentionally, create high, or volcanic islands. These island are based on one or more mountains and have an easily recognizable conical profile. Volcanoes could be really height, like Hawaiian Mauna Kea, standing 4,207 m (~14k ft) above sea level. But, as long as Ireland is selected as a model, I decided to define the highest altitude as 1 kilometer (~3,4k ft). The land elevation is the second key value.
Let’s take a look on a sea temperature. I don’t want to over-complicate the maps handling seasonal climate changes, so we should think in an average annual temperature direction (AAT). Keeping it easy, the AAT at sea level equals to a temperature at the coastline, so on the height = 0.2 in our case. Using the data from climatemps.com I’ve prepared a list of AATs for some places on European coastline. I selected one city to represent each Celsius degree. The place altitude and precipitation are also added:
| City | Temperature, °C | Altitude, m | Precipitation, mm |
|---|---|---|---|
| Messina | 19 | 54 | 830 |
| Seville | 18 | 31 | 610 |
| Athens | 18 | 28 | 375 |
| Lisbon | 17 | 95 | 750 |
| Dubrovnik | 16 | 49 | 1300 |
| Barcelona | 15 | 5 | 660 |
| Marseille | 14 | 32 | 545 |
| Venice | 13 | 6 | 800 |
| Constanta | 12 | 14 | 395 |
| Antwerp | 11 | 16 | 850 |
| Dublin | 10 | 85 | 730 |
| Hannover | 9 | 59 | 655 |
| Gdansk | 8 | 12 | 500 |
| Stockholm | 7 | 52 | 540 |
| Riga | 6 | 9 | 635 |
| Trondheim | 5 | 115 | 860 |
| Reykjavik | 4 | 61 | 800 |
| Tromso | 3 | 9 | 1000 |
| Ust-Tsilma | 2 | 79 | 565 |
| Arkhangelsk | 1 | 4 | 560 |
| Murmansk | 0 | 51 | 490 |
As you can see the temperature range is 0-19 °C. I didn’t find any significant European cities with AAT greater than 19 or sub-zero temperatures. I consider the 10 °C (50 °F) as a standard value (wow, it’s a Dublin, what a coincidence), 5 °C as a normal deviation (Trondheim-Barcelona range) and 10 °C as an extreme deviation (Murmansk-Messina range). Using this ranges we can get a semi-random temperature for each map.
We know that temperatures decrease with altitude and in mountainous regions altitudinal zonation is used to describe the ecosystems. Moreover, we now the rate of decreasing, which is approximately 6.5 °C/km. It means that with highest elevation equals to 1 km, the temperature delta across the map will be about 6.5 °C. From my point of view it’s too low for a fantasy world. We can either increase the lapse rate or the land elevation. As I don’t want to break the basic laws of nature, I increased the peaks up to 2 km height, so the temperature delta is doubled. So with a standard 10 °C temperature at the coast the annual average temperature on the mountain tops will be about -3 °C. On this temperature we can expect peaks to be above the snow line and some beautiful snowcaps should be there.
Knowing a coastal temperature and a cell heights we can calculate temperature for each cell. The general formula is coastal_temperature – (cell_height – sea_level) * 20, where sea level is always 0.2, coastal_temperature is user defined value in a range 0-20 and cell_height is in range 0.2-0.8 (upper bound may vary from map to map). So, a minimal 0.01 point height change will shift the actual temperature to 0.2 °C (0.36 °F). The maximum temperature delta, as was mentioned above, is 13 °C.
The formula to get land elevation is cell_height * (cell_height – 0.195) * 4000. The result is an altitude in meters. The minimum elevation above the sea level is 4 meters (~13 ft), maximum — 1936 meters (~6350 ft). As you can see the function is quadratic, but it’s just a trick to change the altitude more drastically on the mountains. I use elevation values in meters only for a reference as they more user friendly, while system always considers raw cell_height or point_height values. Formula for depths calculation is (cell_height – 0.2) * 70 / cell_height, just for your reference, it is not used for a biomes definition.
As of precipitation, I decided to fit the values I already have into a 0-9 range scale. The most arid cells get moisture level 9, while the wettest get level 0. For a user friendly value I just multiply the initial raw precipitation by 500. So, the minimum non-zero precipitation (0.01) is considered as 5 centimeters (~2 in) of precipitation. The highest value is about 700 cm (~275 in).
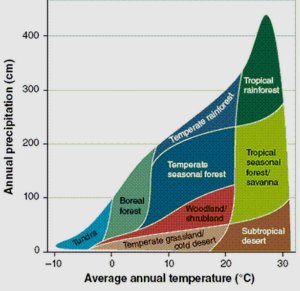
Having both temperature and precipitation key values defined, we can start to think over the biomes. Classical Whittaker diagram defines about 8-10 biomes and looks as a right-angled triangle. This number is too low for me and triangle shape is not very convenient for programming. So, let’s consider the intermediate ones to get about 20 biomes and create a rectangular array instead of Whittaker’s triangular matrix. I could safe some time using more appropriate Holdridge life zones classification, but I noticed it too late.
The y axis is our 10 precipitation levels. The x axis, that defines temperature based on cell height value, contains 100 elements. This is bigger than actual height delta, which is 60 points (0.2-0.8 range), and hence allows us to shift the scale left or right to maintain different coastal temperatures. The shift formula is cell_height * 100 – (coastal_temperature – modifier) / 0.2. Modifier is a customizable value controlling the shift, as of now I set it to 12 to get snow at sub-zero temperatures and hot deserts at highest values.
Biomes matrix implementation is pretty straightforward. Initially I reproduced Whittaker’s diagram in a rectangular form as 100×10 Excel table. Then I added some new intermediate biomes and changed the biomes for actual usage. The main problem is to define good colors for each biome. I was guided by both real-world colors from satellite Earth photos and standard colors used by mapmakers. The general idea is that cells with more moisture should be more saturated than arid ones. One more idea is to define a snow-white layer with some rocky-grey colors for low temperatures.
The next step is to turn the matrix into a JavaScript code. I made a separate jsfiddle as a biomes workshop. It’s not well-done, but has some useful functions to operate with colors and visualize the matrix. It also can interpolate colors in a selected range or smooth the entire axes. I have some ideas on how to turn this fiddle into a built-in custom color-schemes creation module, but it’s not a high-priority plan as of now.
Let’s take a look on the defined biomes. The classification I made is messy and illogical, detailed in some places and too general in others. I was focused mostly on colors than on correct biomes representation. Please note that I use the term temperature as a synonym of average annual temperature. For example you may thing that 20 °C is a comfort temperature, but in real-word we have this AAT in Marrakech, the city sometimes called “the Daughter of the Desert”.
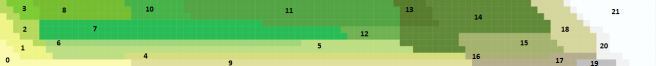
Initially I planned to describe each biome in a separate paragraph and include some bio-geographical information, but I don’t thing it’s really necessary. We all know what is savanna and what is tundra, so here is just a summary table:
| ID | Name | Temperature | Precipitation | Color | |
|---|---|---|---|---|---|
| 0 | Hot desert | hottest-hot | superarid | #fbfaae | |
| 1 | Savanna | hottest | arid | #eef586 | |
| 2 | Tropical dry forest | hottest | humid | #b6d95d | |
| 3 | Tropical wet forest | hottest | superhumid | #7dcb35 | |
| 4 | Xeric srubland | temperate-cold | superarid | #d6dd7f | |
| 5 | Temperate dry grassland | hot-temperate | arid | #bdde82 | |
| 6 | Temperate wet grassland | hot-temperate | subhumid | #a1d77a | |
| 7 | Temperate deciduous forest | hot-temperate | humid | #29bc56 | |
| 8 | Subtropical rain forest | hot | superhumid | #76bd32 | |
| 9 | Cold desert | temperate-cold | superarid | #e1df9b | |
| 10 | Temperate rain forest | temperate | superhumid | #45b348 | |
| 11 | Coniferous wet forest | temperate | superhumid | #52a444 | |
| 12 | Temperate coniferous forest | temperate | humid | #6fb252 | |
| 13 | Subtaiga | cold | superhumid | #567c2c | |
| 14 | Boreal wet forest | cold | humid | #618a38 | |
| 15 | Boreal dry forest | cold | subhumid | #a4b36d | |
| 16 | Subpolar scrub | cold | arid | #acb076 | |
| 17 | Subpolar desert | cold-coldest | superarid-arid | #b5ad8b | |
| 18 | Tundra | coldest | humid | #d5d59d | |
| 19 | Rocky desert | coldest-frosty | superarid | #bfbfbf | |
| 20 | Polar desert | frosty | any | #f2f2f2 | |
| 21 | Glacier | frosty | any | #fafeff |
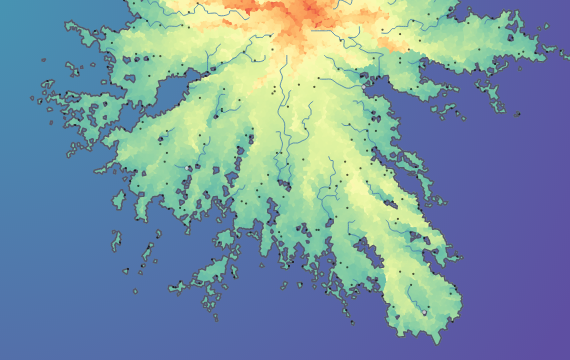
The basic scheme is ready and now we can apply it to a map. I added a separate function that assign biome ID and associated color to each polygon, so it’s easy to render it in polygonal style described in the previous post: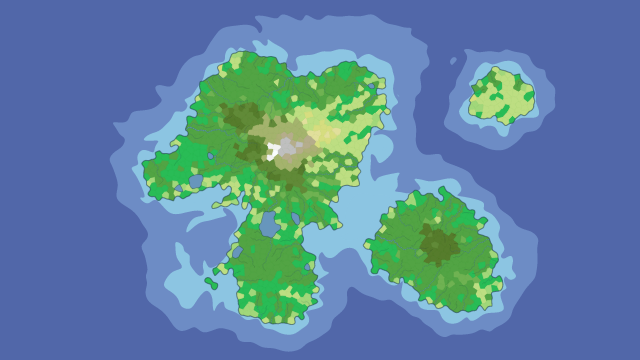
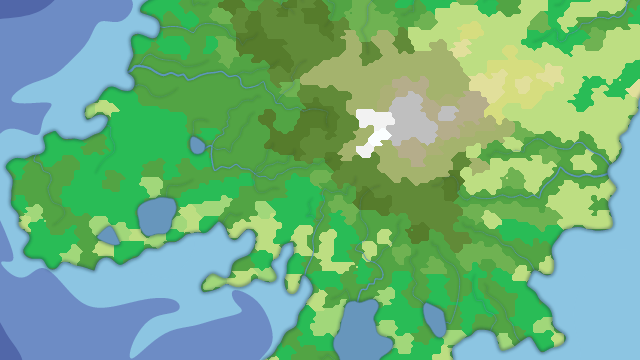
Hm, it could be worse. The temperature is set to default 10 °C, the precipitation level is height. Most of the land is covered with Temperate deciduous (biome 7; 7-8 °C) and Coniferous wet (11; 7-4 °C) forests. The 2000-meters peak in the center has a glacier (biome 21; -1 °C) and slopes with Boreal dry and wet forests (biomes 14-15; 1-2 °C). The right slope is in rain shadow, so there is not too much precipitation and it’s covered mostly with shrubs and grass (biomes 4-5; 3-6 °C). You can also see that rivers tend to spread precipitation and usually river cells have better vegetation that surroundings.
Map looks a bit messy. Too make it better I can smooth the matrix using the linear color interpolation. Color of each element should be the average of its neighbors. After 2-3 cycles I got the updated matrix:
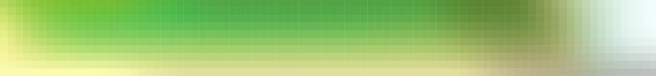
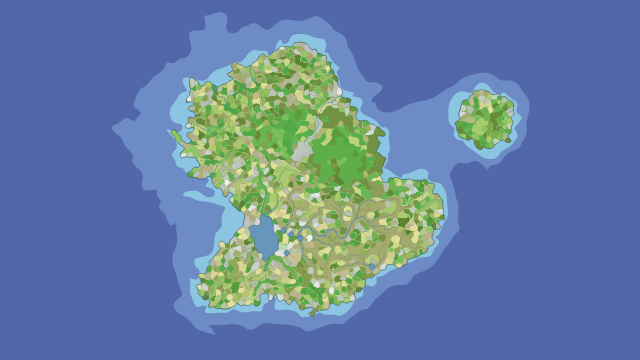
Not let’s apply it to the polygonal map:
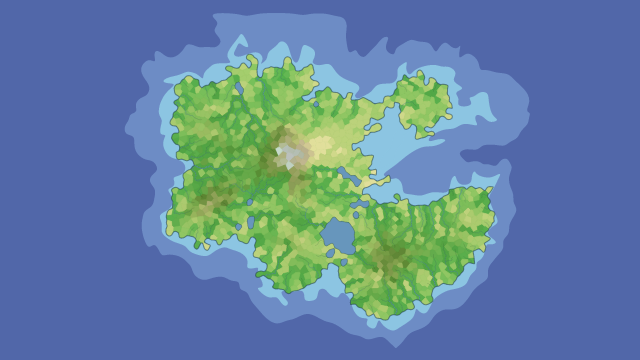
Yes, just slightly better and still a bit messy. It’s not a real issue as I don’t plan to use biomes as a main layer, but I’m still want to try some styles already developed for a heightmap. I shouldn’t add shadows for a biomes, but I can render the map in a plain contours style:
Not sure this style is better. Let’s relax the contours shapes by taking into account just every fourth control point and then smooth it using D3 line interpolation:
Wow, it’s a super-messiness. I definitely need to reduce the layers count:
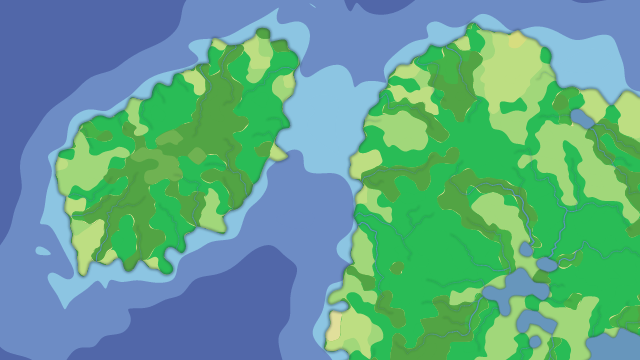
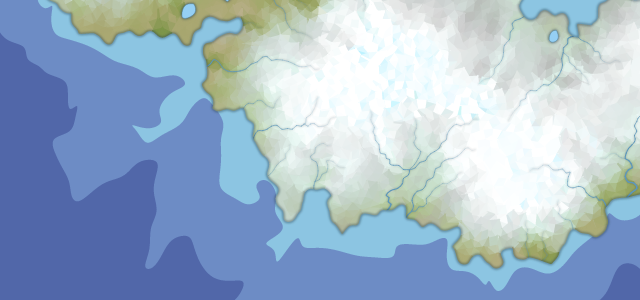
Not bad, I like the organic forms, but there are some rudiments. Maybe I will use this idea with contours simplification for something different. I don’t want to even try the pixel style, so the last one is triangled style:
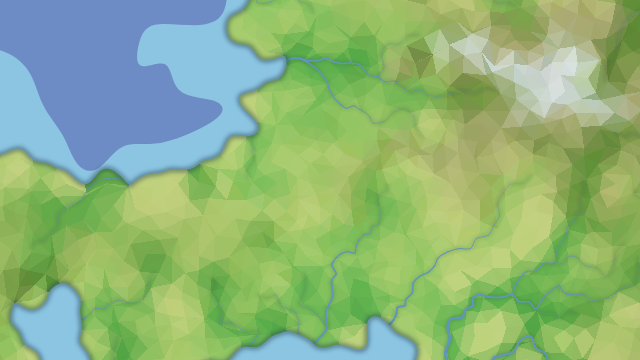
Much better! It gives a lot of details, maybe even more than expected and completely change the map look.
Now let’s check the map in a temperature dynamic. Global warming model based on gradual average annual temperature increase from 0 to 25 °C (refresh the page to restart animation or check the video on YouTube):
Looks good, I suppose. Of course, temperature should affect the rivers, ocean could be covered with ice floes et cetera, but I’m quite happy with the current result as of now.
As usual, I will appreciate you comments and ideas. You are welcome to play with the generator jsfiddle, point me on mistakes and so on.

I’d like to get in touch with you about customizing this code. What is the best way to reach you directly?
LikeLike
Hi! Via my email: maxganiev@yandex.ru
LikeLike
Hey! I have an awesome map that was generated. Is there any way to save it? Either on the website or onto my PC? I can’t seem to figure it out and I can’t close the tab while I wait, help and hurry, please!
LikeLike
Ha! If you use test jsfiddle version, there is a download button (arrow icon). Blocks version is outdated, download function is not added, but there are still two ways:
Save screenshot to get png
Browse throught the source code and save the entire svg element code, I could be then re-saved as svg file
LikeLike
Never been too good with .svg stuff. But I guess screenshots work if I get up and close. I enjoy the jsfiddle version, but the one thing I dislike is the maps haven’t been all as extravagant as the other generator. And it may just be bad luck with the numbers, but I’m not sure, I’ll keep testing it. Also, in jsfiddle, I don’t see manors and regions/countries and that is one of my favorite parts of the other version.
For now I’ll just screenshot, even if I have to zoom in REALLY close to get pictures of towns. But I’d still love help for an easier way if possible.
LikeLiked by 1 person
Great comment, thank you. Regarding island shapes, both versions should work almost the same way, jsfiddle version should have slightly more variations as it’s not aligned to the right side.
As for download function, I will add svg download button to blocks version soon. I hope on this weekend.
For towns and regions. I want to rebuild this part, so it’s not added to the current version.
LikeLike
Newer versions will still have manors and regions? Right? That’s like, one of my favorite things about this since I constantly dispute myself about “cool” border areas. Takes a lot of hassle out of arguing with myself.
LikeLike
I plan to update bl.ocks version just a bit, adding download button and default D3 zooming. For jsfiddle version I need more time as manors remake will take at least month, while currently I’m busy with UI creation.
LikeLike
Alright, thank you for dealing with me! I’ll stick around for future developments.
LikeLike
Hi Kallen. Demo is updated, download button and default D3 zooming are added.
LikeLike
is there a way to edit the manor/region names? This looks like an awesome tool to have for my stories! Just perfect!
LikeLiked by 1 person
Hi! It’s in my to-do list, as well as ability to place your own manors and drag an existing ones. But there are already some ways to amend the labels.
1. Hover the mouse over label and click on the right button. Then select ‘Inspect’ option. Find the label in svg DOM and edit the label, it will be auto updated
2. Download the map and edit the label in any vector graphics editor. Or just edit it any text editor and manually replace the label
LikeLike
Do I understand correctly that this biomes feature is not included in the latest release at https://azgaar.github.io/Fantasy-Map-Generator/ ?
LikeLike
Yes, you are correct. It will be added to the next release.
LikeLike
That’s super cool. Thanks.
LikeLike