
We already got scalable Voronoi graph and heightmap on it. The next step is to draw a coastline that will make the border between water a land masses clearer.
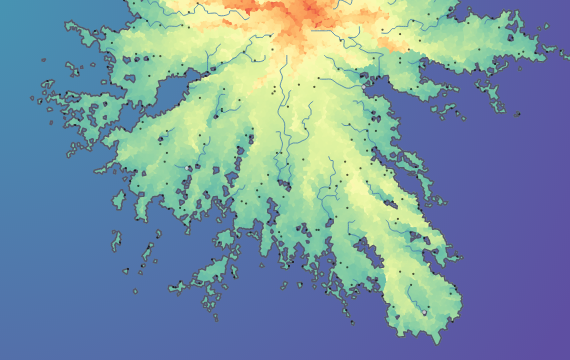
The easiest way to separate land and water is just to omit the water rendering. We can set background to our svg element to represent the water and then draw only the polygons higher than water threshold. It’s a good idea to have a small margin for a water height, it will be useful later. As the currently used spectral color scheme already provides rather plausible colors I prefer to define a sea level to 0.2 (green color starts here). In this case polygons with height less than 0.2 will be considered as water and won’t be drawn, polygons with height more or equal to 0.2 will be considered as lands.
Just minor change and voila, map looks plausible and even close to the some of these NASA relief maps.
Maps look much better if they are outlined, so we need to define and draw a coastline. The easiest way it to loop through the polygons to find the edges between water and land polygons. We can do it in the same manner we defined neighboring polygons:
function drawCoastline() {
  var line = "";
  for (var i = 0; i < polygons.length; i++) {
    if (polygons[i].height >= 0.2) {
      var cell = diagram.cells[i];
      cell.halfedges.forEach(function(e) {
        var edge = diagram.edges[e];
        if (edge.left && edge.right) {
          var ea = edge.left.index;
          if (ea === i) {
            ea = edge.right.index;
          }
          if (polygons[ea].height < 0.2) {
            line += "M" + edge.join("L");
          }
        }
      })
     }
   }
   coastline.append("path").attr("d", line + "Z");
 }
Looks good, but there is a problem. Our coastline is not a line in the sense we usually understand it. Actually it’s just a set of randomly connected edges. It’s enough to outline the island shape, but not suitable if we want to interpolate the coastline, use it as a clip path, fill with background etc.
Transformation of the set of edges into a continuous line is a bit challenging. First of all there can be a couple of islands on the map and each island should have its own separate coastline. Moreover, it will be very useful to know how many isles we have and which polygons located on each island. It’s also good to know which portions of water polygons are lakes and which are oceanic cells.
We will use flood fill method to define geographical features. First, we need to define a start polygon. As we generate island map we can assume that polygons along the borders are oceanic cells. Let’s start from this ocean feature and set initial point as closest polygon to the point with coordinates 0,0 (the top left corner of the map).
Then, using almost the same neighbors detection code, we define all polygons that can be reached via the water polygons only from the start polygon. Mark these polygons as “Ocean”. In case start polygon is a land cell, algorithm will consider all oceanic polygons as just a lake. It’s a rare and non-critical issue, so let it be as is for now.
The next step is to define lakes and islands. Filter unmarked polygons and select the first filtered. If its height less than 0.2, it is Lake. If greater or equal – Island. Just repeat the flood fill for all of the unmarked features. There should not be any unmarked cells when ocean, all lakes and islands are marked.
Let’s also assign a number and a name to each feature. A number is a technical name for Lakes and Islands (we don’t need number for Ocean as it’s unique). I don’t want to focus on names now, so they will be just randomly selected from the array of adjectives. Consider the code below:
function markFeatures() {
  var queue = []; // polygons to check
  var used = []; // checked polygons
  // define ocean cells with start in point 0,0
  var start = diagram.find(0, 0).index; // D3 method to define nearest cell
  queue.push(start);
  used.push(start);
  var type = "Ocean", name;
  if (polygons[start].featureType) {
    name = polygons[start].featureName;
  } else {
    // random name from array of adjectives
    name = adjectives[Math.floor(Math.random() * adjectives.length)];
  }
  polygons[start].featureType = type;
  polygons[start].featureName = name;
  while (queue.length > 0) {
    var i = queue[0];
    queue.shift();
    polygons[i].neighbors.forEach(function(e) {
      if (used.indexOf(e) < 0 && polygons[e].height < 0.2) {
        polygons[e].featureType = type;
        polygons[e].featureName = name;
        queue.push(e);
        used.push(e);
      }
    });
  }
  // define islands and lakes
  var island = 0, lake = 0, number = 0, greater = 0, less = 0;
  var unmarked = $.grep(polygons, function(e) {
    return (!e.featureType);
  });
  while (unmarked.length > 0) {
    // island if height >= 0.2
    if (unmarked[0].height >= 0.2) {
      type = "Island";
      number = island;
      island += 1;
      greater = 0.2;
      less = 100; // just to omit exclusion
    } else {
      type = "Lake";
      number = lake;
      lake += 1;
      greater = -100; // just to omit exclusion
      less = 0.2;
    }
    name = adjectives[Math.floor(Math.random() * adjectives.length)];
    start = unmarked[0].index;
    polygons[start].featureType = type;
    polygons[start].featureName = name;
    polygons[start].featureNumber = number;
    queue.push(start);
    used.push(start);
    while (queue.length > 0) {
      var i = queue[0];
      queue.shift();
      polygons[i].neighbors.forEach(function(e) {
      if (used.indexOf(e) < 0 && polygons[e].height >= greater && polygons[e].height < less) {
        polygons[e].featureType = type;
        polygons[e].featureName = name;
        polygons[e].featureNumber = number;
        queue.push(e);
        used.push(e);
      }
    });
  }
  unmarked = $.grep(polygons, function(e) {
    return (!e.featureType);
  });
  }
}
The next step is to change a bit out initial drawCoastline function in order to collect the coastline data. It should contain not only the edges coordinates, but also information regarding type of the coast. We cannot calculate a continuous line for ocean and lakes as the same time, so the type will show whether is’s an edge between land and ocean or an edge between land and lake:
function drawCoastline() {
  for (var i = 0; i < polygons.length; i++) {
    if (polygons[i].height >= 0.2) {
      var cell = diagram.cells[i];
      cell.halfedges.forEach(function(e) {
        var edge = diagram.edges[e];
        if (edge.left && edge.right) {
          var ea = edge.left.index;
          if (ea === i) {
            ea = edge.right.index;
          }
          if (polygons[ea].height < 0.2) {
            // store edge start and end point separately
            var start = edge[0].join(" ");
            var end = edge[1].join(" ");
            // store Island number for a ocean coast
            if (polygons[ea].featureType === "Ocean") {
              var type = "Island";
              var number = polygons[i].featureNumber;
            // store Lake number for a lake coast
            } else {
              var type = "Lake";
              var number = polygons[ea].featureNumber;
            }
            // push Data to array
            line.push({start, end, type, number});
          }
        }
      })
    }
  }
}
Looping through all our islands and lakes we can successively detect the coastline for all the features. Then we will filter the line array to contain only data for a single feature. Now it’s time to unite edges into a continuous line.
We already know two line segments: start and end edges which are the first array element. Shift the array to remove that element and filter the rest of the array to find the next segment. As coastline is always continuous (if only you didn’t place your isles along the borders) the next segment will be an edge with start or end equal to the previous segment’s end. Line is closed when found element’s end point equals to the first segment’s start point. A bit confusing, so here is a code:
// find continuous coastline (island-ocean)
var number = 0; // featureNumber
var type = "Island"; // start from isles
var edgesOfFeature = $.grep(line, function(e) {
  return (e.type == type && e.number === number);
});
while (edgesOfFeature.length > 0) {
  var coast = []; // array to store coastline for feature
  var start = edgesOfFeature[0].start; // start point of first element
  var end = edgesOfFeature[0].end; // end point of first element
  edgesOfFeature.shift();
  var spl = start.split(" "); // get array from string
  coast.push({x:spl[0], y:spl[1]}); // push start to coastline
  spl = end.split(" ");
  coast.push({x:spl[0], y:spl[1]}); // push end to coastline
  // use for instead of while to avoid eternal loop
  for (var i = 0; end !== start && i < 2000; i ++) {
    var next = $.grep(edgesOfFeature, function(e) {
      return (e.start == end || e.end == end);
    });
    if (next.length > 0) {
      if (next[0].start == end) {
        end = next[0].end;
    } else if (next[0].end == end) {
      end = next[0].start;
    }
    spl = end.split(" ");
    coast.push({x:spl[0], y:spl[1]});
  }
  var rem = edgesOfFeature.indexOf(next[0]);
  edgesOfFeature.splice(rem, 1);
 }
 // do the same for all Lakes
 }
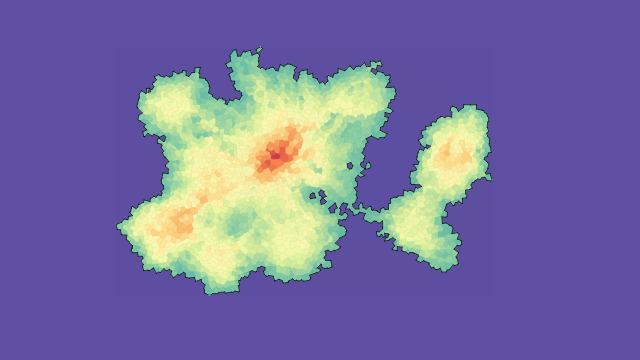
When a separate line for every feature is found we may draw a coastlines. It’s a good idea to use two different styles for sea and lake coasts. As lines are continuous nothing prevent us from filling the path with any color, pattern or image we want. We also can use D3 curves interpolations to smooth out the lines. The only problem with this idea is that our line won’t match with existing polygons shape (refer to image on the right).
There are a couple of possibilities here. We can stop to draw detached polygons and use filling colors or patterns instead. This will save a lot of resources and I will definitely do it, but this is completely another story of moving to a hand-drawn map style. As of heightmap, we can use the coastlines as a clip paths to show only the parts of polygons that lie inside the interpolated coastline. To avoid the empty areas inside the clip path we need to create a background layer colored as the lowest island polygons:


Looks great… but path clip for a lot of polygons is extremely slow in Chrome and just slow in Firefox. We can significantly reduce the elements count applying clipping only to polygons along the coastline, but even in these case rendering is slow.
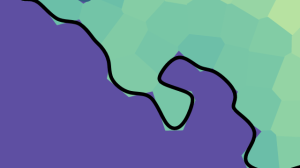
Another variant is just to omit coastal polygons rendering at all. This way will be even faster than initial linear variant, but polygons contours will be clearly visible and this is not good. To resolve this new issue we can apply blur filter to the edges, but I’m not sure I like the result, especially on zooming:


Hatching along the coast it’s another thing I’ve played with this week. Against the blur effect, I like the hatching and definitely will use it somehow or other.
One more idea is to interpolate not only coastline, but polygons themselves to be aligned with coasts. Sounds interesting and may be promising with some shading, but looks no so neat as I want.


You need also realize that using curves as a coastlines brakes our grid structure. In my map generator I create cities and river estuaries on the coastline edges and I don’t want to adjust the element to the curse any time I need to place something on the seashore. Close look to both curved and linear coastline variants:


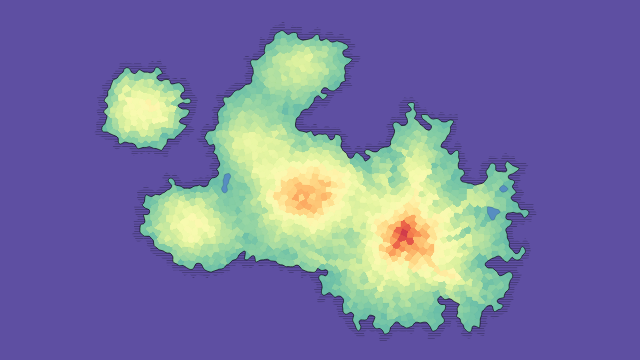
Nonetheless I like curved coastlines and want to use them. Moreover, after two days of testing I found good and even obvious solution: if we can’t use clip path as we need to crop a lot of elements, let’s clip the coastline from the other side. This can be done using svg mask.
First we need to create mask element inside svg defs. Mask element should contain basic rectangle covering all the map with white fill (white means visible in case of masks). Then we will add coastline paths to the same mask element with black fill. As the last step we append rectangle with mask attribute colored as background. This will create blue perforated mask. Locate the mask on the layer which is higher than our inner-island map, so mask will hide the unwanted polygon’s parts. The result is below:
I’ve added some useful interactive features to the JSFiddle playground so feel free to use or fork it. This is a test version so issues are typical. Please report if bugs will provide unexpected benefits.
Let me know if you have any ideas either on coastline rendering or other aspects. I’m most interesting in semi-3d effects, such as shading and hatching as I’m still not satisfied with current ‘flat’ style. I’ll do my best to continue this blog with a good-looking solution.

Why are the mountains only in the middle of the map? Why no coast cliff?
LikeLike
This is how the algorithm works. It generates a king of volcanic islands with the highest point in the middle. You may simulate coast cliffs putting blobs manually, but generally system is not built for that.
Islands generation covered in a separate post.
LikeLike
Looking good! Perhaps for a semi-3d effect, you could try something like the river valley shadows from here: https://heredragonsabound.blogspot.com/2017/04/various-miscellany-part-1.html
LikeLiked by 1 person
Thanks! I’ve tried to shade all the map, but result is little bit messy. I did not try to shade the rivers yet, so thank you for the idea. I thing I will try this together with “plausible rivers” implementation.
LikeLike
The same method could be used to shade the coast
LikeLiked by 1 person
Tried with old rivers – https://jsfiddle.net/byzeyLaa/77/
How do you find the shading?
LikeLike
This is the most amazing stuff Azgaar! I’ve been using your map creator for days and days. So powerful and unique! Amazing. This will really revolutionary for both game design and writers (like me).
LikeLike
Thank you, William! It’s still a long way to the version 1.0. I’m going to add more tools, improve performance and stabilize the code for the release version, but there is not chance it will be in 2018.
LikeLike